Everything you need to turn tables into visuals
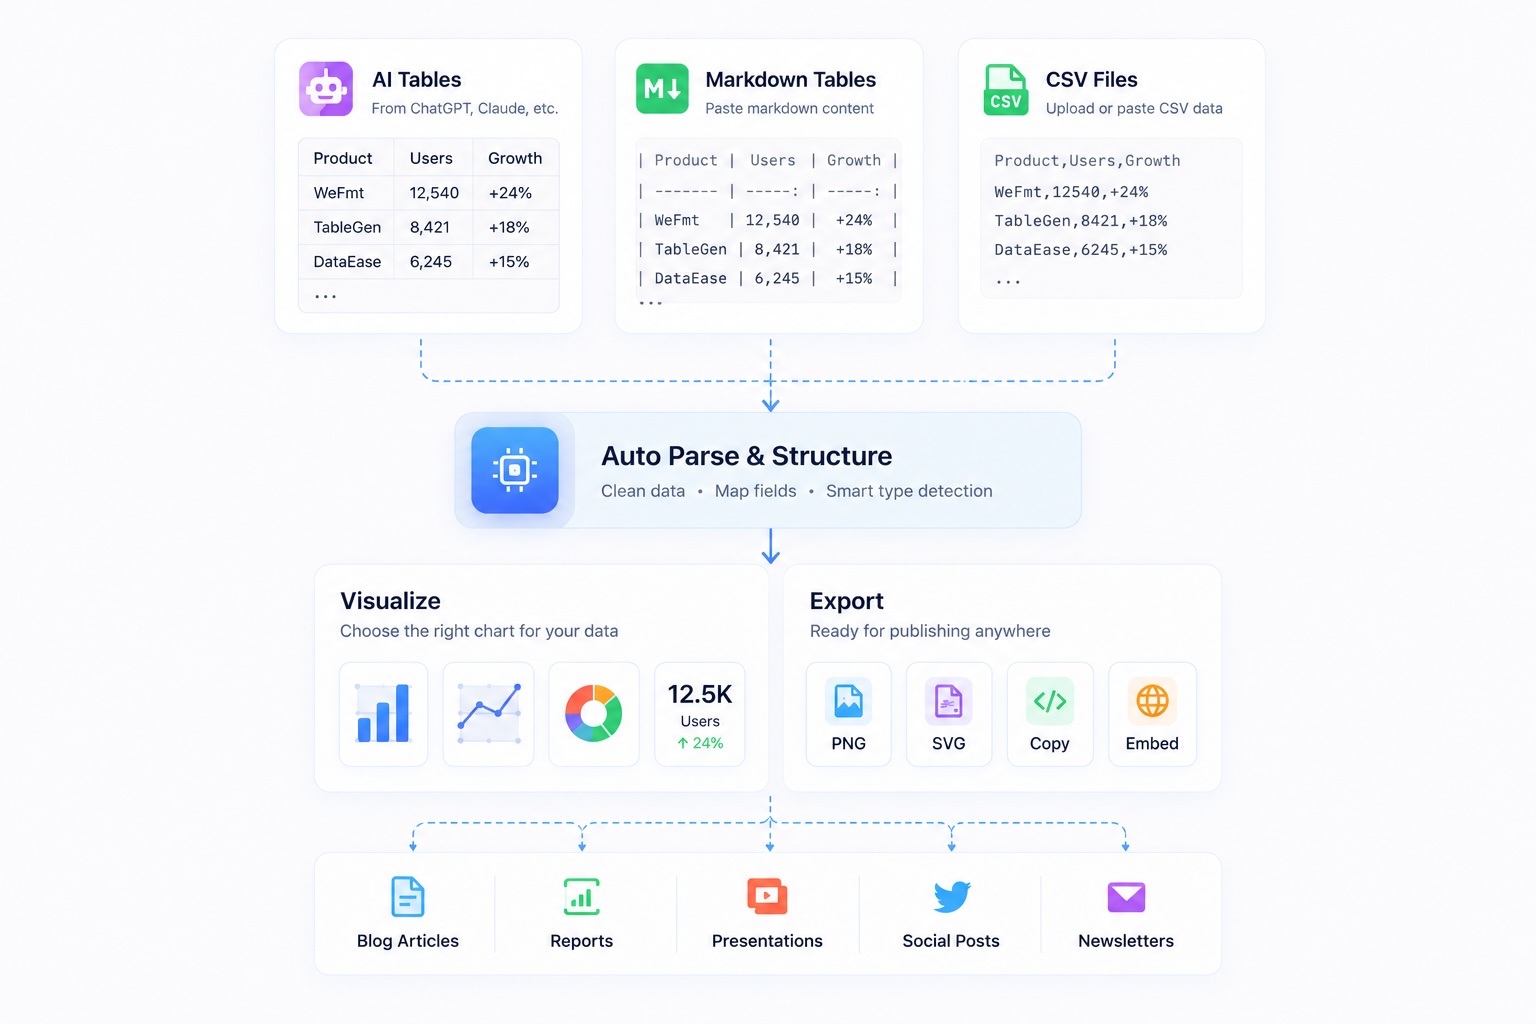
Paste data from AI replies, Markdown tables, or CSV files, then turn it into clean charts, cards, and publish-ready visuals in your browser.
WeFmt focuses on lightweight data visualization: paste data, generate visuals quickly, and export for publishing. Not heavy BI, but an efficient formatting tool for creators and operations teams.
Paste tables from ChatGPT or Claude and generate clean, publish-ready charts.
Supports Markdown table input and auto-maps chart structure to reduce manual cleanup.
Paste CSV data and quickly create publish-ready visuals for reports and content distribution.
Paste data from AI replies, Markdown tables, or CSV files, then turn it into clean charts, cards, and publish-ready visuals in your browser.
Formatter
Use WeFmt Formatter to edit, preview, and quickly export reusable content for publishing workflows. Supports exporting .md content to .docx files.
Open Formatter